
Features
What This Site Does That The Leaderboards Don't
Ten things worth knowing about, and where to go try each one.
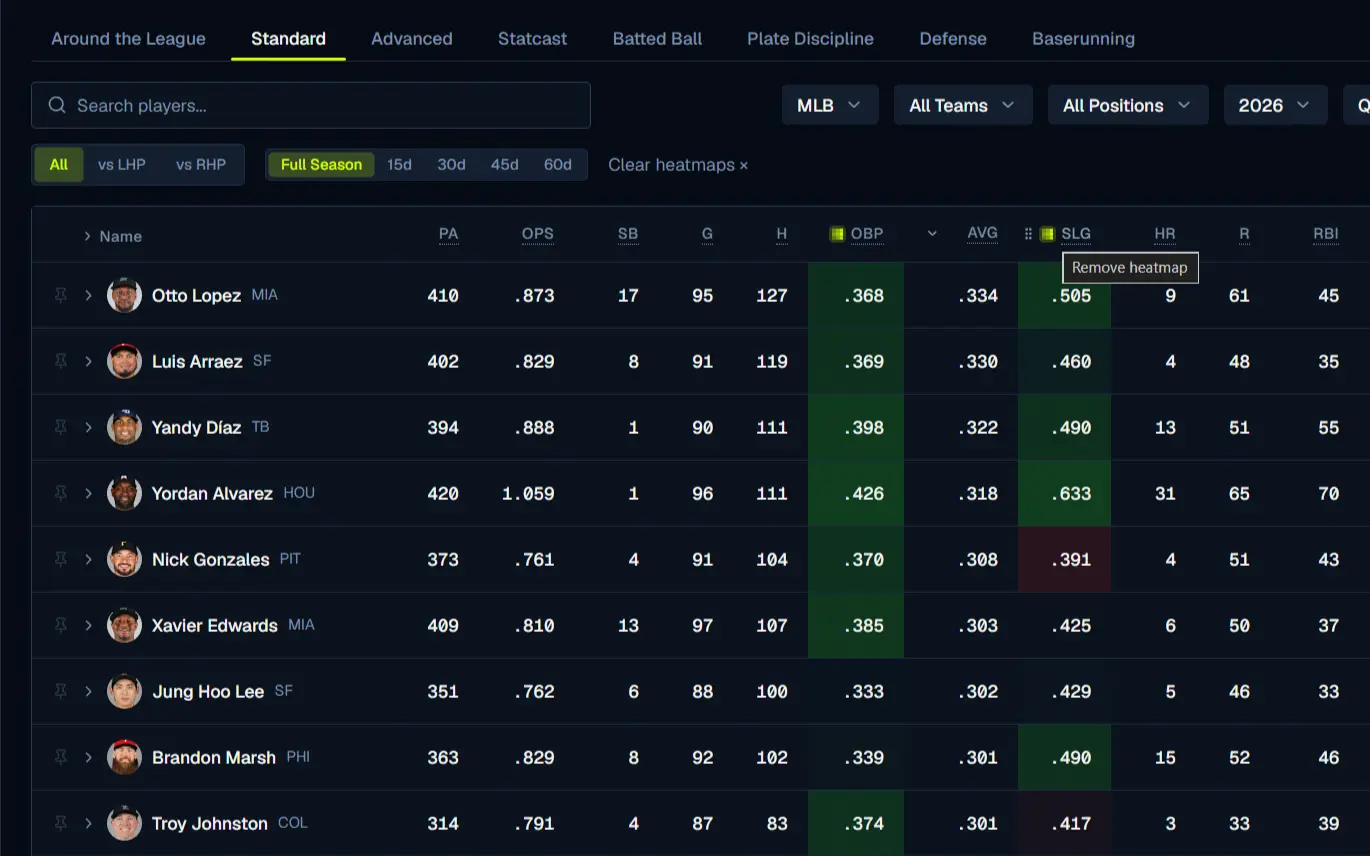
Heatmap any column
- Click a column header's grid icon to shade every cell by league rank.
- Direction is set per stat, so a low ERA shades green.
- Light up several columns to see which numbers carry a player.
Pin players to the top
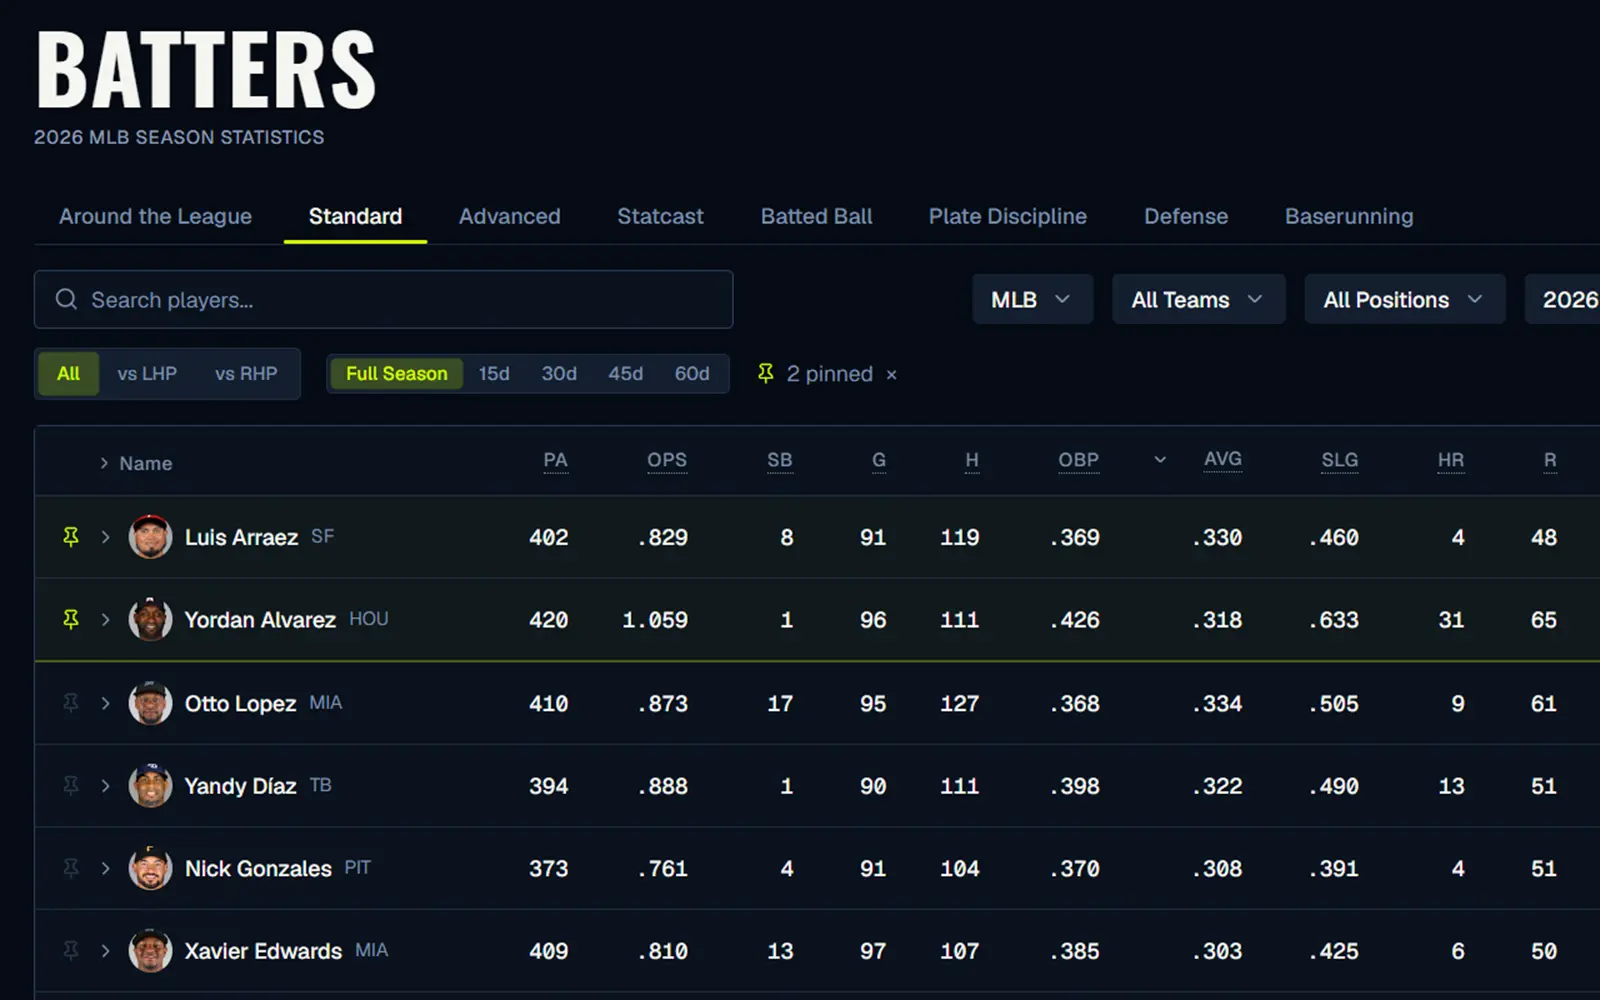
- Click the pin in a row's gutter to lock that player above everyone.
- Pinned rows stay on top through every sort and filter.
- Pins are remembered on your next visit.
See splits without leaving the row
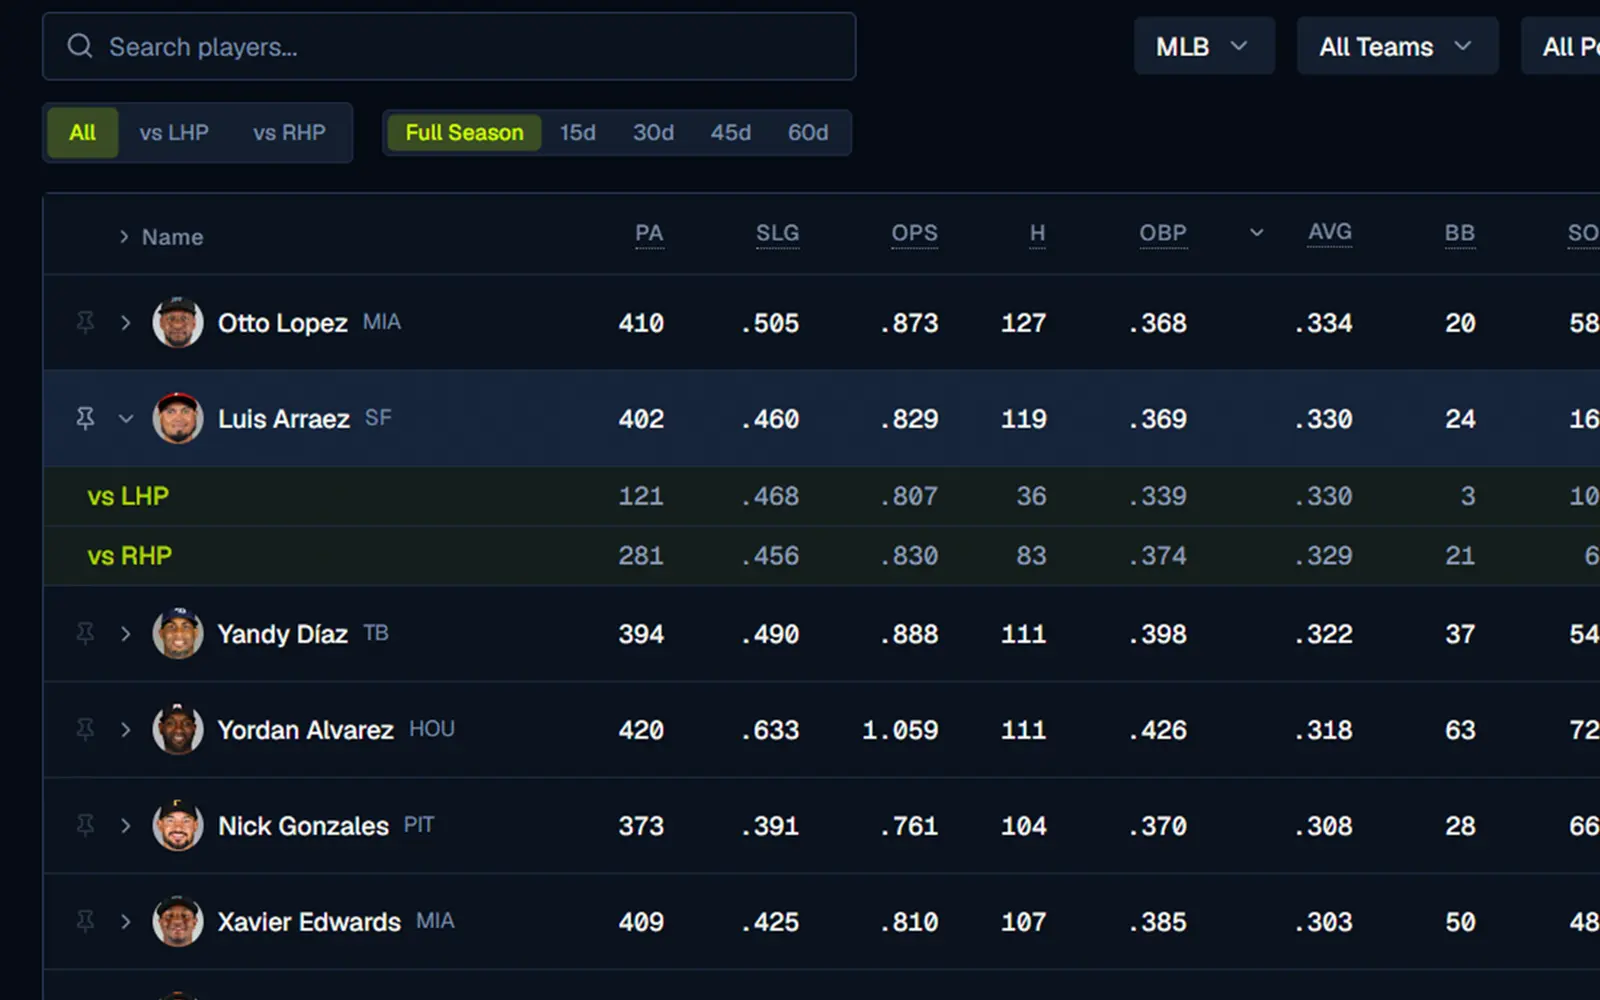
- Click the chevron on any row to expand it in place.
- vs LHP and vs RHP splits appear as rows, in the same columns.
- Use the traditional splits toggle to filter all players.
Drag to reorder columns
- Drag a column's grip handle to move that stat anywhere in the table.
- The name column stays anchored on the left.
- Order is saved per tab.
Pick your columns
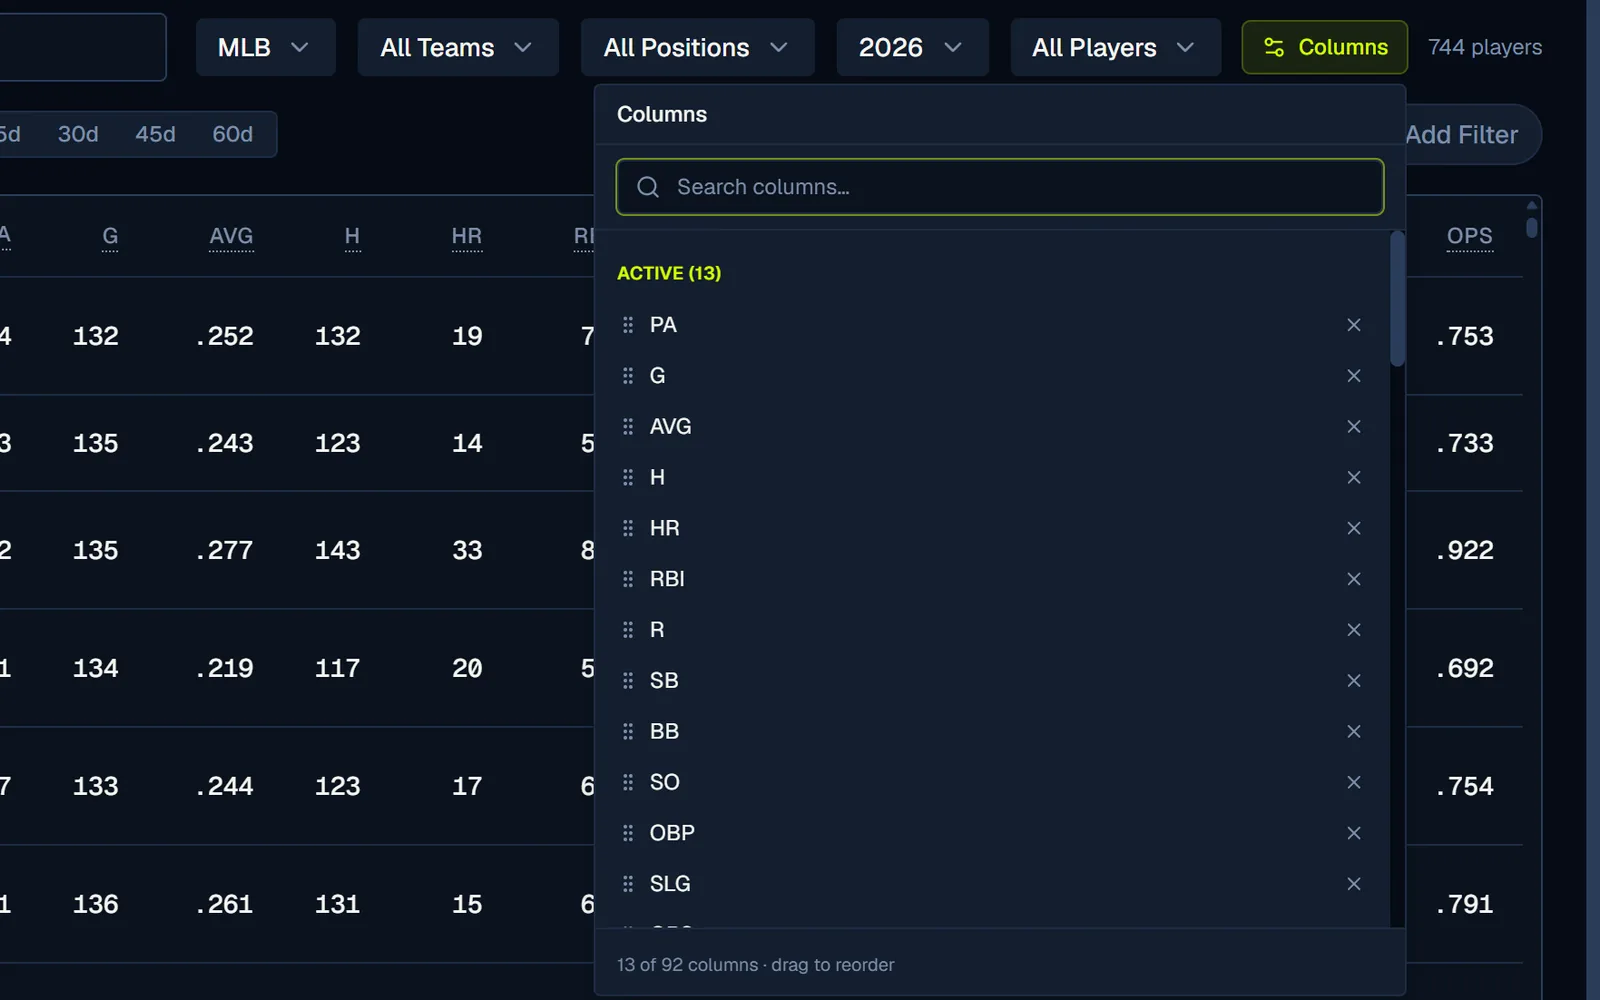
- The Columns button opens 90+ batter stats in seven groups.
- Add what you need, drop what you don't, drag the active list into order.
- Each tab keeps its own set.
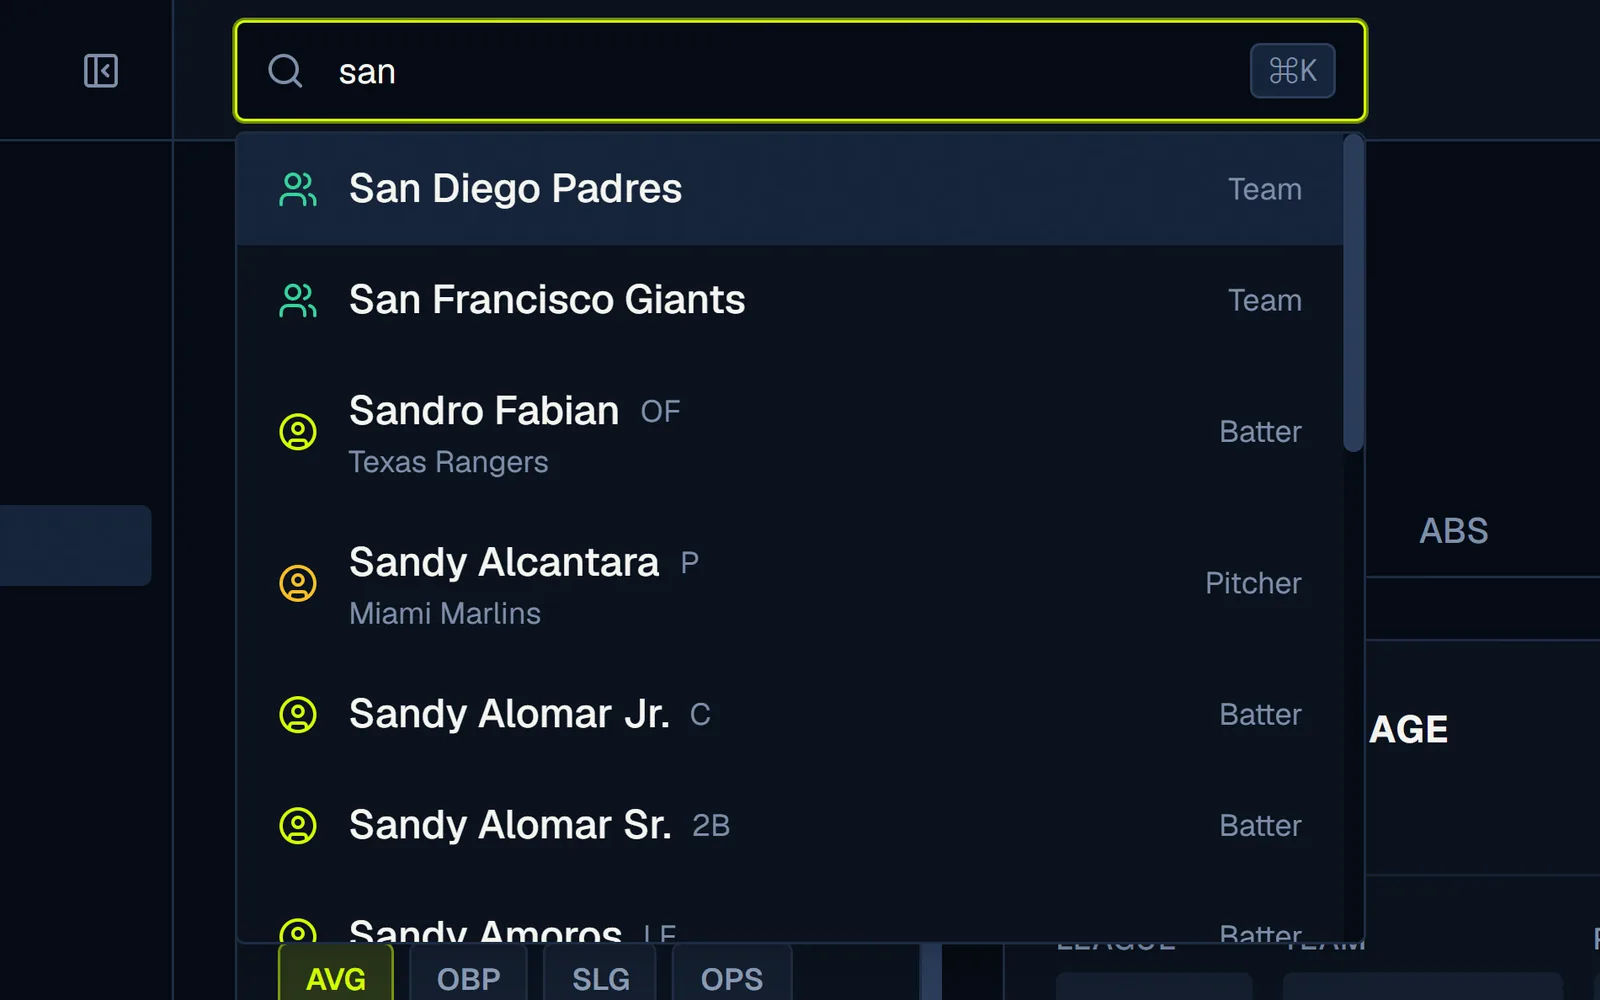
Search from anywhere with ⌘K
- Press ⌘K, or Ctrl+K on Windows, on any page and type a name.
- Results are labeled Batter, Pitcher, or Team. Enter opens the profile.
- Covers active and historical players back to 1901.
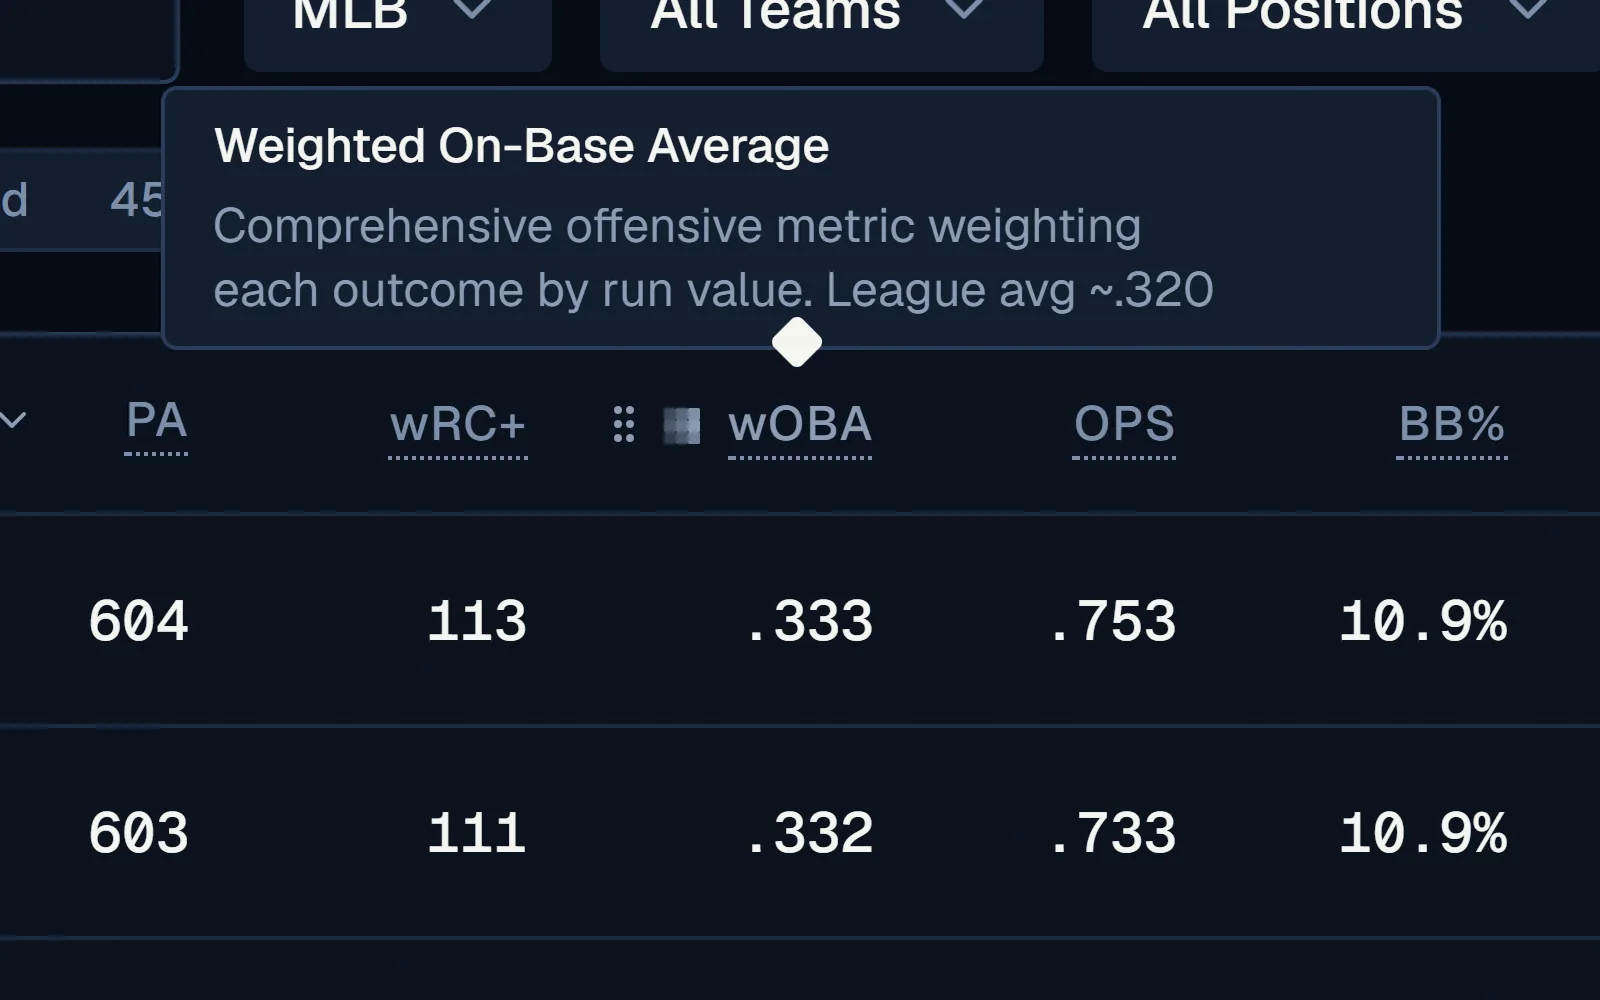
Stat descriptions on hover
- Any abbreviation with a dotted underline has a definition on hover or focus.
- Each one gives the full name, one line of explanation, and a league average.
- The Glossary covers the same ground at more length.
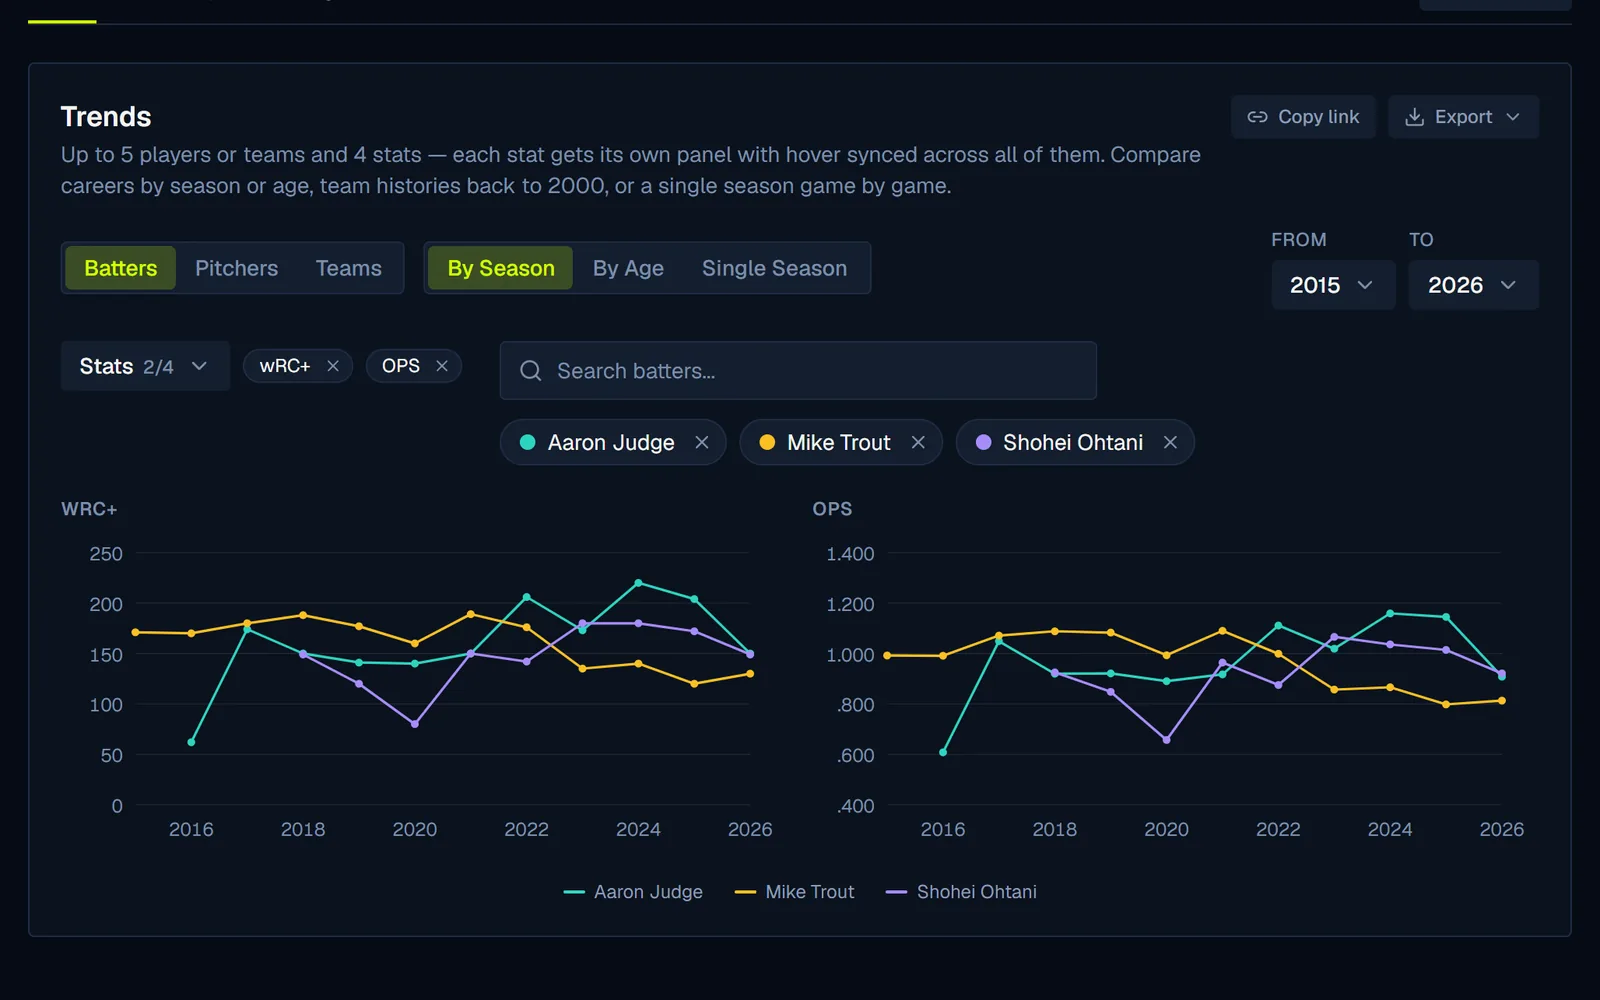
Sandbox: customizable visuals
- Overlay up to five players or teams across seasons, ages, or single-season games.
- Scatterplot any two stats, with size, color, and age filters.
- The chart filters live in the URL.
- Login for access to the Scatterplot and League Trends tabs.
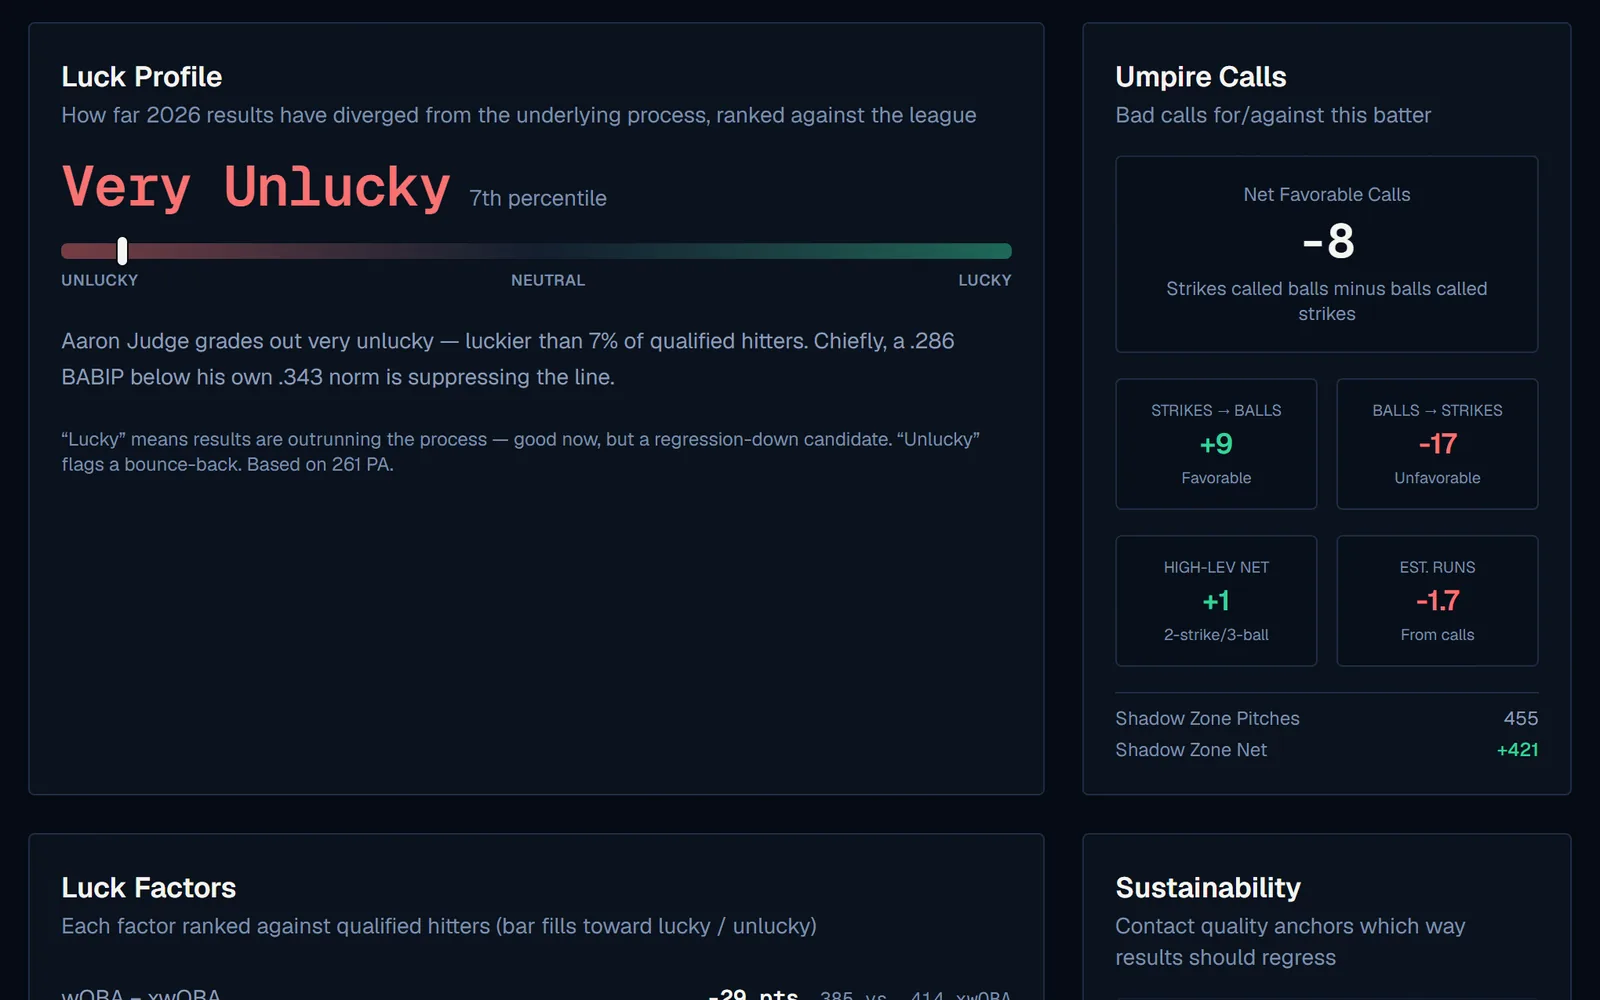
Luck Profile
- Takes into account relative performance vs. career averages.
- wOBA vs xwOBA, BABIP, and call luck resolve to one percentile and a verdict.
- Umpires grades every called pitch against the rulebook zone, shadow zone included.
The weekly roundup, and AI chat
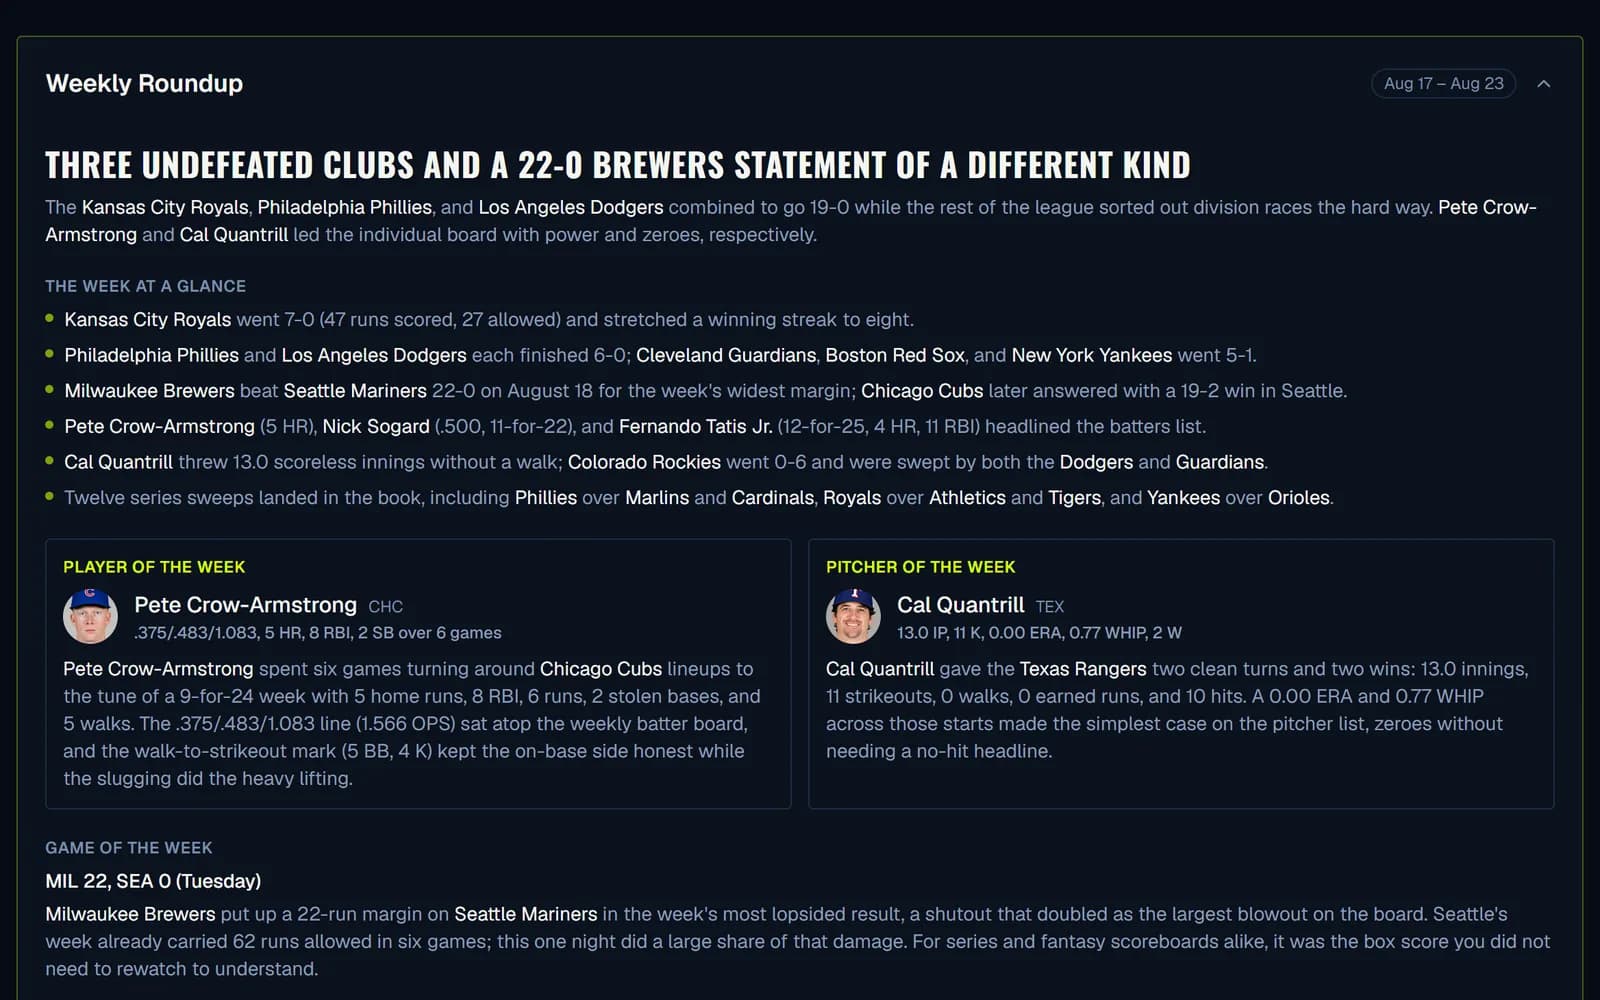
- Each Monday a roundup recaps the week: awards, game of the week, standings, moves.
- Written from a fact pack built from our database, so every number is copied.
- AI Chat, which answers questions against pitch-level data, is in private beta.
Questions
How is the data aggregated?
Statcast, batted-ball, and plate-discipline numbers are aggregated from pitch-level tracking data, which starts in 2015 — columns that depend on it are labeled with the first season they exist.
Do I need an account?
No. Leaderboards, player and team pages, ballparks, umpires, the glossary, and the Sandbox Trends tab are all open. Login to customize themes, favorite-team preferences, saved Sandbox views, and the Sandbox Scatterplot and League Trends tabs.
Are my table layouts saved?
Yes, in your browser. Visible columns, column order, heatmaps, and pinned players are stored per page and per tab, with separate layouts for desktop and mobile. They survive reloads and new visits, but they do not follow you to another device.
How far back does the data go?
League-wide season trends in the Sandbox reach back to 1901. Player and team pages cover the modern era, and anything Statcast-derived — expected stats, exit velocity, barrels, swing and chase rates — begins in 2015.
How often is it updated?
A nightly job ingests the previous day's games, so stats, leaderboards, and standings reflect completed games through yesterday. The footer of every page shows the last successful update.
What is the shadow zone?
The band of pitches within about two inches of the strike-zone edge, inside or outside. Those are the calls umpires actually get wrong, so scoring them separately keeps easy pitches down the middle from flattering everyone's accuracy.